
This is something that WordPress sends to all people who use their blogging platform, or so it seems. Interesting to see – my BIO101 posts are getting a lot of traffic from searches, as always. Funny to see “3 views” as the highest ever – something went wrong with their stats on that one (it’s probably 3000) 😉
==============
The stats helper monkeys at WordPress.com mulled over how this blog did in 2010, and here’s a high level summary of its overall blog health:

The Blog-Health-o-Meter™ reads Wow.
Crunchy numbers
The Louvre Museum has 8.5 million visitors per year. This blog was viewed about 100,000 times in 2010. If it were an exhibit at The Louvre Museum, it would take 4 days for that many people to see it.
In 2010, there were 1184 new posts, growing the total archive of this blog to 10386 posts. There were 197 pictures uploaded, taking up a total of 271mb. That’s about 4 pictures per week.
The busiest day of the year was August 3rd with 3 views. The most popular post that day was The PepsiGate linkfest.
Where did they come from?
The top referring sites in 2010 were scienceblogs.com, twitter.com, andrewsullivan.theatlantic.com, Google Reader, and blogs.discovermagazine.com.
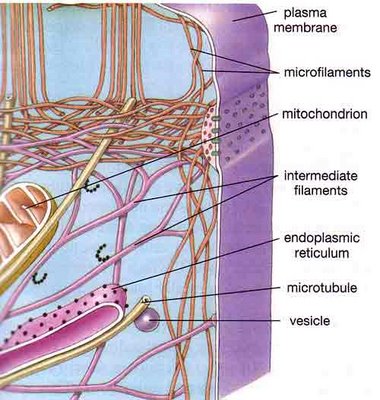
Some visitors came searching, mostly for eukaryotic cell, cell structure, action potential, action potential graph, and cell differentiation.
Attractions in 2010
These are the posts and pages that got the most views in 2010.
The PepsiGate linkfest July 2010
7 comments
Alert! Some Big And Important And Exciting News! September 2010
108 comments and 3 Likes on WordPress.com
A Farewell to Scienceblogs: the Changing Science Blogging Ecosystem July 2010
86 comments and 3 Likes on WordPress.com
BIO101 – Cell Structure August 2010
21 comments
Drumroll, please! Introducing: Scienceblogging.org August 2010
33 comments and 3 Likes on WordPress.com


